Microsoft recently published a technical whitepaper outlining considerations for a well-performing and secure organizational Power BI deployment.
You may like to see the full report here. However, if you don’t have enough time to read all of that, here are the most important points:
1. Introduction
High level overview of Power BI as both a SaaS (software-as-a-service) and PaaS (platform-as-a-service) platform:

- The most prominent components of the Power BI suite of tools include: Power BI Desktop, Power BI Service, Power BI Mobile Apps, Power BI Report Server, and Power BI Embedded
- Power BI Service is built on Microsoft’s Azure environment, e.g. user data is uploaded in Blob storage and metadata is stored in SQLDB
2.Deployment Options and Recommendations
We face a combination of business requirements and technical requirements when making decisions related to technology deployments. The scenarios are:
A. Self-service data analysis (ad hoc analysis):
With self-service scenarios, users import data into Power BI and create their own dataset (aka data model) and calculations, followed by reports and dashboards.
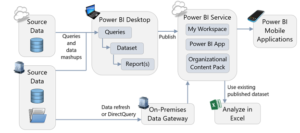
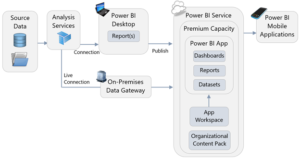
B. Organizational reporting (traditional enterprise reporting / corporate BI):
Power BI issues live queries to retrieve source data when a report is viewed. This scenario can also be handled with Direct Query functionality (for a relational data source) or a Live Connection (for an Analysis Services data source, SSAS Tabular Model).
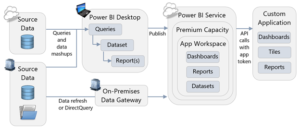
C. Embedded analytics (operational reporting): It can be embedded into a custom application using custom APIs.
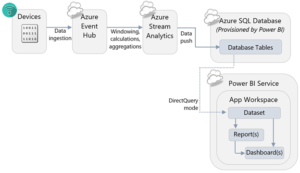
D. Streaming (near real-time monitoring): it can be used effectively for a streaming dashboard solution, in conjunction with Azure Stream Analytics, the Power BI APIs, or PubNub
There are some key questions to ask when planning a deployment such as:
- Where is the source data stored?
- Who is going to use the reports?
- Where do consumers want to view reports?
- How much data latency (delay) is acceptable?
- What is the complexity level of the solution?
- Is an On-Premises (Non-Cloud-Based) solution required?
3. Licensing Options
The licensing model your organization selects for Power BI significantly impacts deployment options and scalability possibilities. The Power BI licensing model is based on three options to simplify choices and better meet the varying needs of individuals, small groups, and large organizations including, Power BI Free, Power BI Pro, Power BI Premium
4. Source Data Considerations
While Power BI can connect to many different types of data sources, some types of data sources should be preferred over others.
Some things to consider include:
- Minimize use of Excel, csv, and text files when possible
- Store files in a central location, accessible by all users of the Power BI solution
- Be aware of API limits
- Know how to support SaaS solutions from AppSource
- Minimize the load on source systems
- Expect data refresh operations to take some time
- Test data refresh in the Power BI Service regularly during development
- Utilize relational database sources when practical
- Assume referential integrity when possible to improve performance
Cleansing, Filtering, Transforming, and Integrating Data
Power BI has some very powerful functionality for cleansing, filtering, transforming, and integrating data in its Query Editor so this is not a question of whether Power BI is able to do the job. However, creating a centralized data repository to store data that has already been cleansed is one way of reducing the amount of data preparation work that end users need to do in Power BI.
If that repository is a relational database, such as SQL Server, then it can also solve some of the problems described earlier in this section to do with loading data from Excel files, web services, and line-of-business systems.
5. Power BI Data Storage Options:
In many cases it may not be easy to choose the right storage mode for a particular report.
The recommendations can be summarized as follows:
Only use real-time streaming datasets if:
- You need near real-time data to be displayed as soon as it is generated, and
- You are using a service such as Azure Stream Analytics or a custom application that can deliver data through the API to Power BI
Only use Direct Query if:
- Your data needs to be refreshed more quickly than it can feasibly be loaded into a Power BI imported dataset or an Analysis Services database
- Regulatory concerns mean that your data cannot be stored in a Power BI imported dataset or an Analysis Services database
- Your data volumes are so large that the data you need cannot be loaded into a Power BI imported dataset or an Analysis Services database
- Your dataset is simple, consisting of relatively few tables and relationships
- You are using very few DAX measures or calculated columns in your reports
- You are using a data source such as SQL Server that supports DirectQuery mode
Use Live Connections to Analysis Services if:
- You already have all the data you need in Analysis Services Multidimensional cubes, or ideally, Analysis Services Tabular models
- Row-level security is required but managing RLS within individual Power BI datasets would introduce too much management overhead
- Your end users do not need to customize the datasets or work with data that is not currently stored in Analysis Services
- You have the resources in-house to support an instance of Analysis Services
- Your end users already use, or wish to use, Analysis Services with other tools such as Reporting Services or Excel
- You need a great degree of control over processing, monitoring, fault tolerance, and other architectural features
Consider Azure Analysis Services over on-premises Analysis Services if:
- Some or all of your data sources already reside in the cloud
- Testing shows that the latency involved with using data from an on-premises instance of Analysis Services through the On-Premises Gateway in a Power BI report has a noticeable effect on report performance
- You have no legal requirements to store data on-premises
- You do not already have an on-premises instance of Analysis Services (or you purposely want a new Analysis Services instance)
- You want to be able to scale up and down on demand
Use imported datasets stored in Power BI Premium storage instead of Analysis Services if:
- You prefer easy management over cost and fine control over configuration
- Your mix of report developers and read-only consumers means that it is more cost-effective to use Power BI Premium versus Analysis Services
Use Power BI Premium, regardless of whether you are using an imported dataset stored in Premium capacity or you are storing your data in Analysis Services if:
You have a large number of concurrent users and find that the user experience for operations like publishing reports, using the API and changing settings in the web interface is unacceptably slow with just Pro licenses and/or
Your mix of report developers and read-only consumers means that it is more cost-effective to use Power BI Premium versus just Power BI Pro licenses
6. Data Refresh and the On-Premises Data Gateway
If you are importing data into a Power BI dataset then you must ensure that Power BI can connect back to its data sources for scheduled refresh to take place. Similarly, if you are using a Live Connection to Analysis Services or Direct Query mode then Power BI must be able to connect to the data source to run queries when reports are rendered. Since most enterprise data sources are on-premises and Power BI (unless you are using Power BI Report Server) is a cloud-based service, an On-premises data gateway must be used to allow Power BI to connect from the cloud to on-premises data sources.
The On-premises data gateway can be installed in one of two modes.
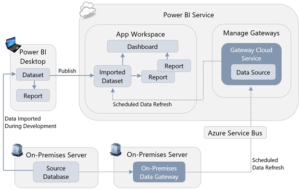
Mode 1: On-Premises Data Gateway
The On-premises data gateway is intended for enterprise-wide deployments. The following diagram depicts a scheduled data refresh which is executed via the On-Premises Data Gateway installed within the corporate network:
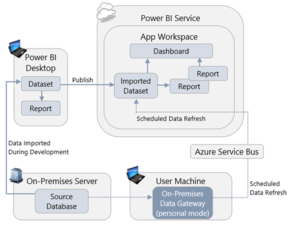
On-premises data gateway (personal mode) involves installing the On-Premises Data Gateway, in personal mode on an individual user’s machine for purposes of scheduled data refresh.
The following diagram depicts a scheduled data refresh of an imported dataset which is executed via the Personal Gateway:
7. Report Development Considerations and Best Practices for Report Design in Power BI Desktop
Controls over who builds reports, where these reports are published, and how many reports are published, are essential if you are going to avoid thorny issues later on in your project.
A lot of work can go into designing a report and you should take care that this work is not lost by making sure that reports are safeguarded with a copy of each version when changes are made.
Separating Dataset Development from Report Authorship
In many cases, business users just want to create their own reports and may not have the skill, time, or desire to build a dataset for that report. If users do create datasets associated with every report they build, this can result in the creation of many duplicate datasets. Therefore, it is important to separate the development of the datasets used by reports from the reports themselves wherever possible.
Use Templates to Speed Up and Standardize Report Development
Building new reports from scratch can be time-consuming, and enforcing standards on those reports can be extremely difficult. The use of Power BI templates (.pbit files) can speed up report development significantly, and help with standardization.
Centralize Data Source Connection Information
It is very likely that a report will contain queries that import multiple tables of data from the same data source. The Query Editor in Power BI makes it easy to do this. However, each query that it creates contains the connection information for the data source. As a result, this makes it difficult to change the connection information in the future because it requires an edit to each query. An alternative is to utilize parameters in the Query Editor window containing the connection information before you connect to the data source. Then, when you do connect to the data source to import your data, use the parameters to supply the connection information to the queries instead of typing it in.
Minimizing the Amount of Data Loaded
When you are importing data into Power BI (rather than using Direct Query or a Live Connection) it is important to limit that data to only what is needed for the reports you are building. There are two ways to reduce the amount of data stored in a dataset:
Remove columns from source tables in the Query Editor
Filter the rows in your source tables down to just the slice of data you need, either by using hard-coded filters in the Query Editor or by using query parameters.
If you are utilizing a data warehouse or similar data structure which is in dimensional format, then a date dimension table is likely to be readily available. In that case, you can disable the Auto Date/Time feature of Power BI Desktop which automatically creates date tables in the background for each date column in your dataset. Disabling this feature, which is done in the Data Load pane of the Options dialog in Power BI Desktop, can significantly reduce the size of a dataset.
Minimizing the Amount of Data Displayed on a Page
The more visuals you put on a page, and the more data displayed in these visuals, the slower your report will be to render and the harder it will be for users to make sense of. Reports which are slow and difficult to interpret are unpleasant to use and will discourage people from using solutions created with Power BI.
While custom visuals provide rich ways for visualizing your data, you should be aware that they should be treated with caution. It is important to understand that custom visuals have access to the data that in Power BI datasets and those custom visuals are not blocked from sending this data out of the Power BI service, so make sure that you are not using custom visuals from sources that you don’t trust.
Creating Dashboards to Help Navigation
A user can treat a dashboard as something like a start page or executive summary: if all looks well the user does not need to look at the underlying reports, but if necessary the user can click on a visualization and navigate to the report it comes from to see it in context.
Also, because you can pin visualizations from multiple reports, from Excel workbooks, and even from SQL Server Reporting Services reports and the new Power BI Report Server, you can use dashboards to create a unified view of metrics from different reports created in different tools.
8. Collaboration and Sharing
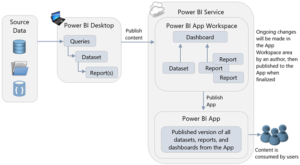
When a report is published, it goes to a workspace. There are two types of workspaces in Power BI:
My Workspace: Every Power BI user has a workspace called My Workspace which is intended purely for personal use. Publishing a report here can be useful during development because it allows you to test what your report looks like in a browser or on a mobile app.
App Workspace: App Workspaces are shared workspaces where multiple users can collaborate on report development.
9. Administration, Security, and Compliance
Every organization using Power BI should specify at least two administrators to manage its tenant.
Ideally, planning a Power BI deployment should start before anyone has even logged in to Power BI for the first time. The first task of the person charged with configuring a new Power BI tenant is to find whoever it is in the organization who administers Office 365 or Azure Active Directory.
Choosing an Azure Data Center for Power BI
When a Power BI tenant is created, it is created in an Azure data center. Choosing the correct Azure data center to host your Power BI tenant is important for two reasons:
- It may be important for legal reasons that corporate data is stored in a specific jurisdiction.
- The performance of reports and dashboards depends, in part, on users being in close proximity to the Power BI tenant.
Managing Users and Licenses, Data Privacy, and Security
It will be useful to monitor usage of Power BI for a variety of other reasons apart from compliance, for example:
To determine which users are making frequent use of Power BI and which users are not. If Power BI is not being used regularly by some or all users it will be necessary to find out why, and take action. Perhaps more training is required? It may be due to dashboards and reports not displaying the required data? Or, perhaps reports are slow to render or respond and need tuning to improve the user experience.
Since Power BI relies on Azure Active Directory (AAD) for authentication, it can use AAD’s full range of functionality to control where and how users can log in to Power BI.
At the most basic level, whether a user can see a given piece of information is determined by whether he or she has access to an App Workspace, App or Organizational Content Pack that displays that data.
For situations where different users should only see some of the data in a dataset, Power BI row-level security allows filters to be applied on the rows in any table in that dataset.
Securing Data at the Data Source Level
Since creating, managing, and maintaining row-level security can be difficult across multiple datasets, it may make more sense to apply security at the data source level instead, if that is possible.
Restricting Sharing and Publishing
As well as restricting access to App Workspaces, Apps and Organizational Content Packs, you will likely also want to specify who may publish Apps and Organizational Content Packs.
Data Privacy Levels in M Queries
One easy-to-miss feature around data security is the concept of data privacy levels for loading data. In certain scenarios, the M queries that Power BI uses to load data into datasets may be able to gain a significant performance boost by sending data from one data source to another.
